When the relation between drug dose (X-axis) and drug response (Y-axis) is plotted on a linear scale, the resulting curve is usually hyperbolic. Clinical responses that might be plotted in this way include change in heart rate, blood pressure, gastric pH or blood glucose. Non-clinical (biochemical) responses can also be plotted in this way including enzyme activity, accumulation of an intracellular second messenger, membrane potential, secretion of a hormone, or contraction of a muscle.
If the drug dose is plotted on a base 10 logarithmic scale, this produces a sigmoidal dose-response curve. This representation is more useful because it expands the dose scale in the region where drug response is changing rapidly and compresses the scale at higher doses where large changes have little effect on response. Note that, in reality, it is ligand concentration (and resulting receptor occupation) that affects response – the term ‘dose-response curve’ assumes that the drug dose and ligand concentration are closely linked.
Dose-response: basic principles
In very general terms dose response curves are a graphical representation of a specific functional reaction in a cell, tissue, or organism evoked by a range of doses of a given stimulus at a certain point in time. Stimuli can be internal or external, physical or chemical. In basic pharmacology dose-response curves are used to calculate binding affinities for receptor-ligand interactions for example.
Box 1 shows a hypothetical dose-response curve, highlighting some of the important parameters that can be drawn from it.

In clinical pharmacology dose-response curves are more likely to be evaluating responses to drugs. Drug dose-response involves the principles of pharmacokinetics and pharmacodynamics and can be used to determine the required dose and frequency to achieve the desired response, for example the desired drug effect. Multiple factors can cause variation in dose-response curves: population differences, patient-related factors and measurement methodologies for example, but repeated measurements carried out under identical conditions can help establish the pharmacologic profile of the drug being evaluated. The dose-response relationship is important because the concentration of a drug at its site of action controls its effect.
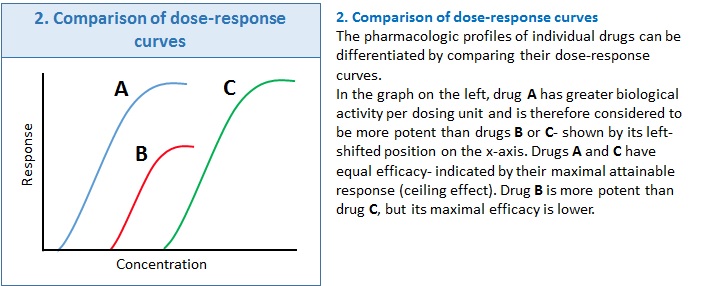
Box 2 shows how drug profiles can be compared based on their plotted dose-response curves.